How e-commerce is redefining global shopping trends
How e-commerce is redefining global shopping trends
by
7 min read
10 min read
7 min read

In the fast-paced world of Digital Out-of-Home (DOOH) advertising, data is everything. Yet, for many marketers and advertisers, terms like ad loops, heat maps, and impressions can feel more like industry jargon than actionable insights. Understanding these metrics is crucial for optimizing campaigns, enhancing performance tracking, and ultimately improving ROI.
As a leader in smart DOOH innovation, dKilo DOOH is here to break down what these key metrics mean and how they empower advertisers to make data-driven decisions.
Ad loops refer to the full sequence of ads that play in a rotation on a DOOH screen. For example, if a screen runs a loop of 6 ads every 2 minutes, your ad’s frequency and timing depend on its placement in the loop.
Why it matters:
Placement within the loop affects visibility and recall.
Ad loop timing helps determine impression counts.
Understanding loops enables better bidding and scheduling decisions.
By analyzing ad loops, advertisers can tailor content to hit at peak visibility times, and adjust campaign strategy dynamically through dKilo DOOH’s advanced dashboard tracking.
Heat maps in DOOH metrics represent the geographic and temporal engagement levels of your ads. By using data from sensors, GPS, and mobile devices, heat maps show where and when your ads get the most attention.
Benefits of heat maps:
Identify high-traffic zones.
Optimize ad placements for maximum exposure.
Analyze behavioral patterns to adjust campaign targeting.
Using heat maps, dKilo DOOH helps brands visualize their campaign performance with interactive tracking tools, turning spatial data into actionable strategy.
Impressions refer to the estimated number of people who have seen your ad. In DOOH, this is calculated using traffic data, dwell times, screen size, and ad duration.
Why impressions matter:
Core metric for campaign reach.
Essential for calculating ROI.
Key to understanding audience impact.
Through real-time data streams, dKilo DOOH provides impression-based analytics that fuel transparent and measurable performance reports.
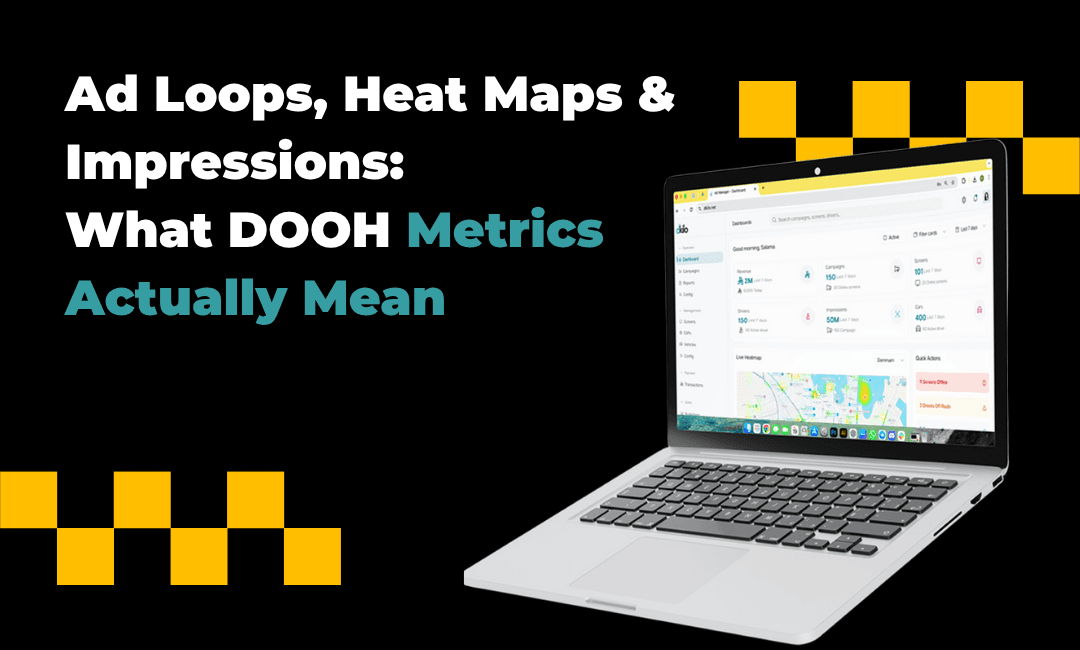
DOOH’s advantage lies in its ability to provide live campaign tracking. Using the dKilo DOOH dashboard, advertisers can monitor everything from impressions and heat zones to loop frequency and engagement stats.
Dashboard features include:
Real-time analytics visualization.
Campaign adjustment tools.
ROI estimation based on live tracking.
This level of transparency lets advertisers fine-tune campaigns on the fly—maximizing budget efficiency and performance.
At the end of the day, every metric feeds into one goal: return on investment. By combining ad loops, heat maps, and impressions into a unified dashboard, dKilo DOOH provides the clarity needed to track and boost ROI.
How metrics drive ROI:
Accurate impressions inform cost-per-view analysis.
Heat maps enable smarter placement strategies.
Loop data helps reduce ad fatigue and boost audience recall.
When advertisers can see exactly where their money goes—and what it brings back—they can confidently scale their DOOH strategies.
DOOH advertising is evolving into a highly intelligent medium. Metrics like ad loops, heat maps, and impressions aren’t just buzzwords—they’re powerful tools that, when tracked effectively, transform advertising outcomes.
With dKilo DOOH’s cutting-edge tracking dashboard, advertisers unlock the full potential of their campaigns—converting data into action and insights into ROI.
Ready to make your metrics work for you? Explore the dKilo DOOH dashboard today. www.dkilo.com

